Two Weird Things
Why queues matter in software development: Part I of a series

This is part one of a series. In part 2, The Cost of Long Queues, you’ll explore the surprising and escalating costs of unmanaged queues. In part 3, Avoiding Long Queues, you’ll see how to avoid long queues in software development processes.
If you work on a software team and you're interested in how to work more effectively, I'd like to invite you on a little journey to understand two weirdly unintuitive things.
There's something weird about randomness.
Let's play a game to demonstrate. Imagine I flip a coin repeatedly. When it lands on heads, you add 1 to a total which starts at 0. When it lands on tails, you subtract 1.
What will the total be after 10 flips? Think about it and make a guess. What about after 100 flips? Any different? Are any values less or more likely? What about after 10,000 flips? What about (please forgive me, mathematicians) after an infinite number of flips?
I would bet that a lot of you guessed that the total would most likely be 0 after 10 flips. If you did say this, I bet you also stuck with 0 even as the number of flips increased. Maybe when I started talking about infinity, some of the mathematically-inclined got an inkling about the kind of weird thing that's happening here.
The weird thing is this: you're right that 0 is the most likely individual value for the cumulative total, but a non-zero value is highly probable. The more flips, the less likely the total is to be 0. As our number of flips approaches infinity, the probability of the total being 0 approaches 0, and outcomes with high magnitude — either positive or negative — become more and more likely.
You don't believe me? I didn't believe it when I heard this. So, instead of you taking out a coin and a piece of paper to try it, the illustration below will simulate it for you.
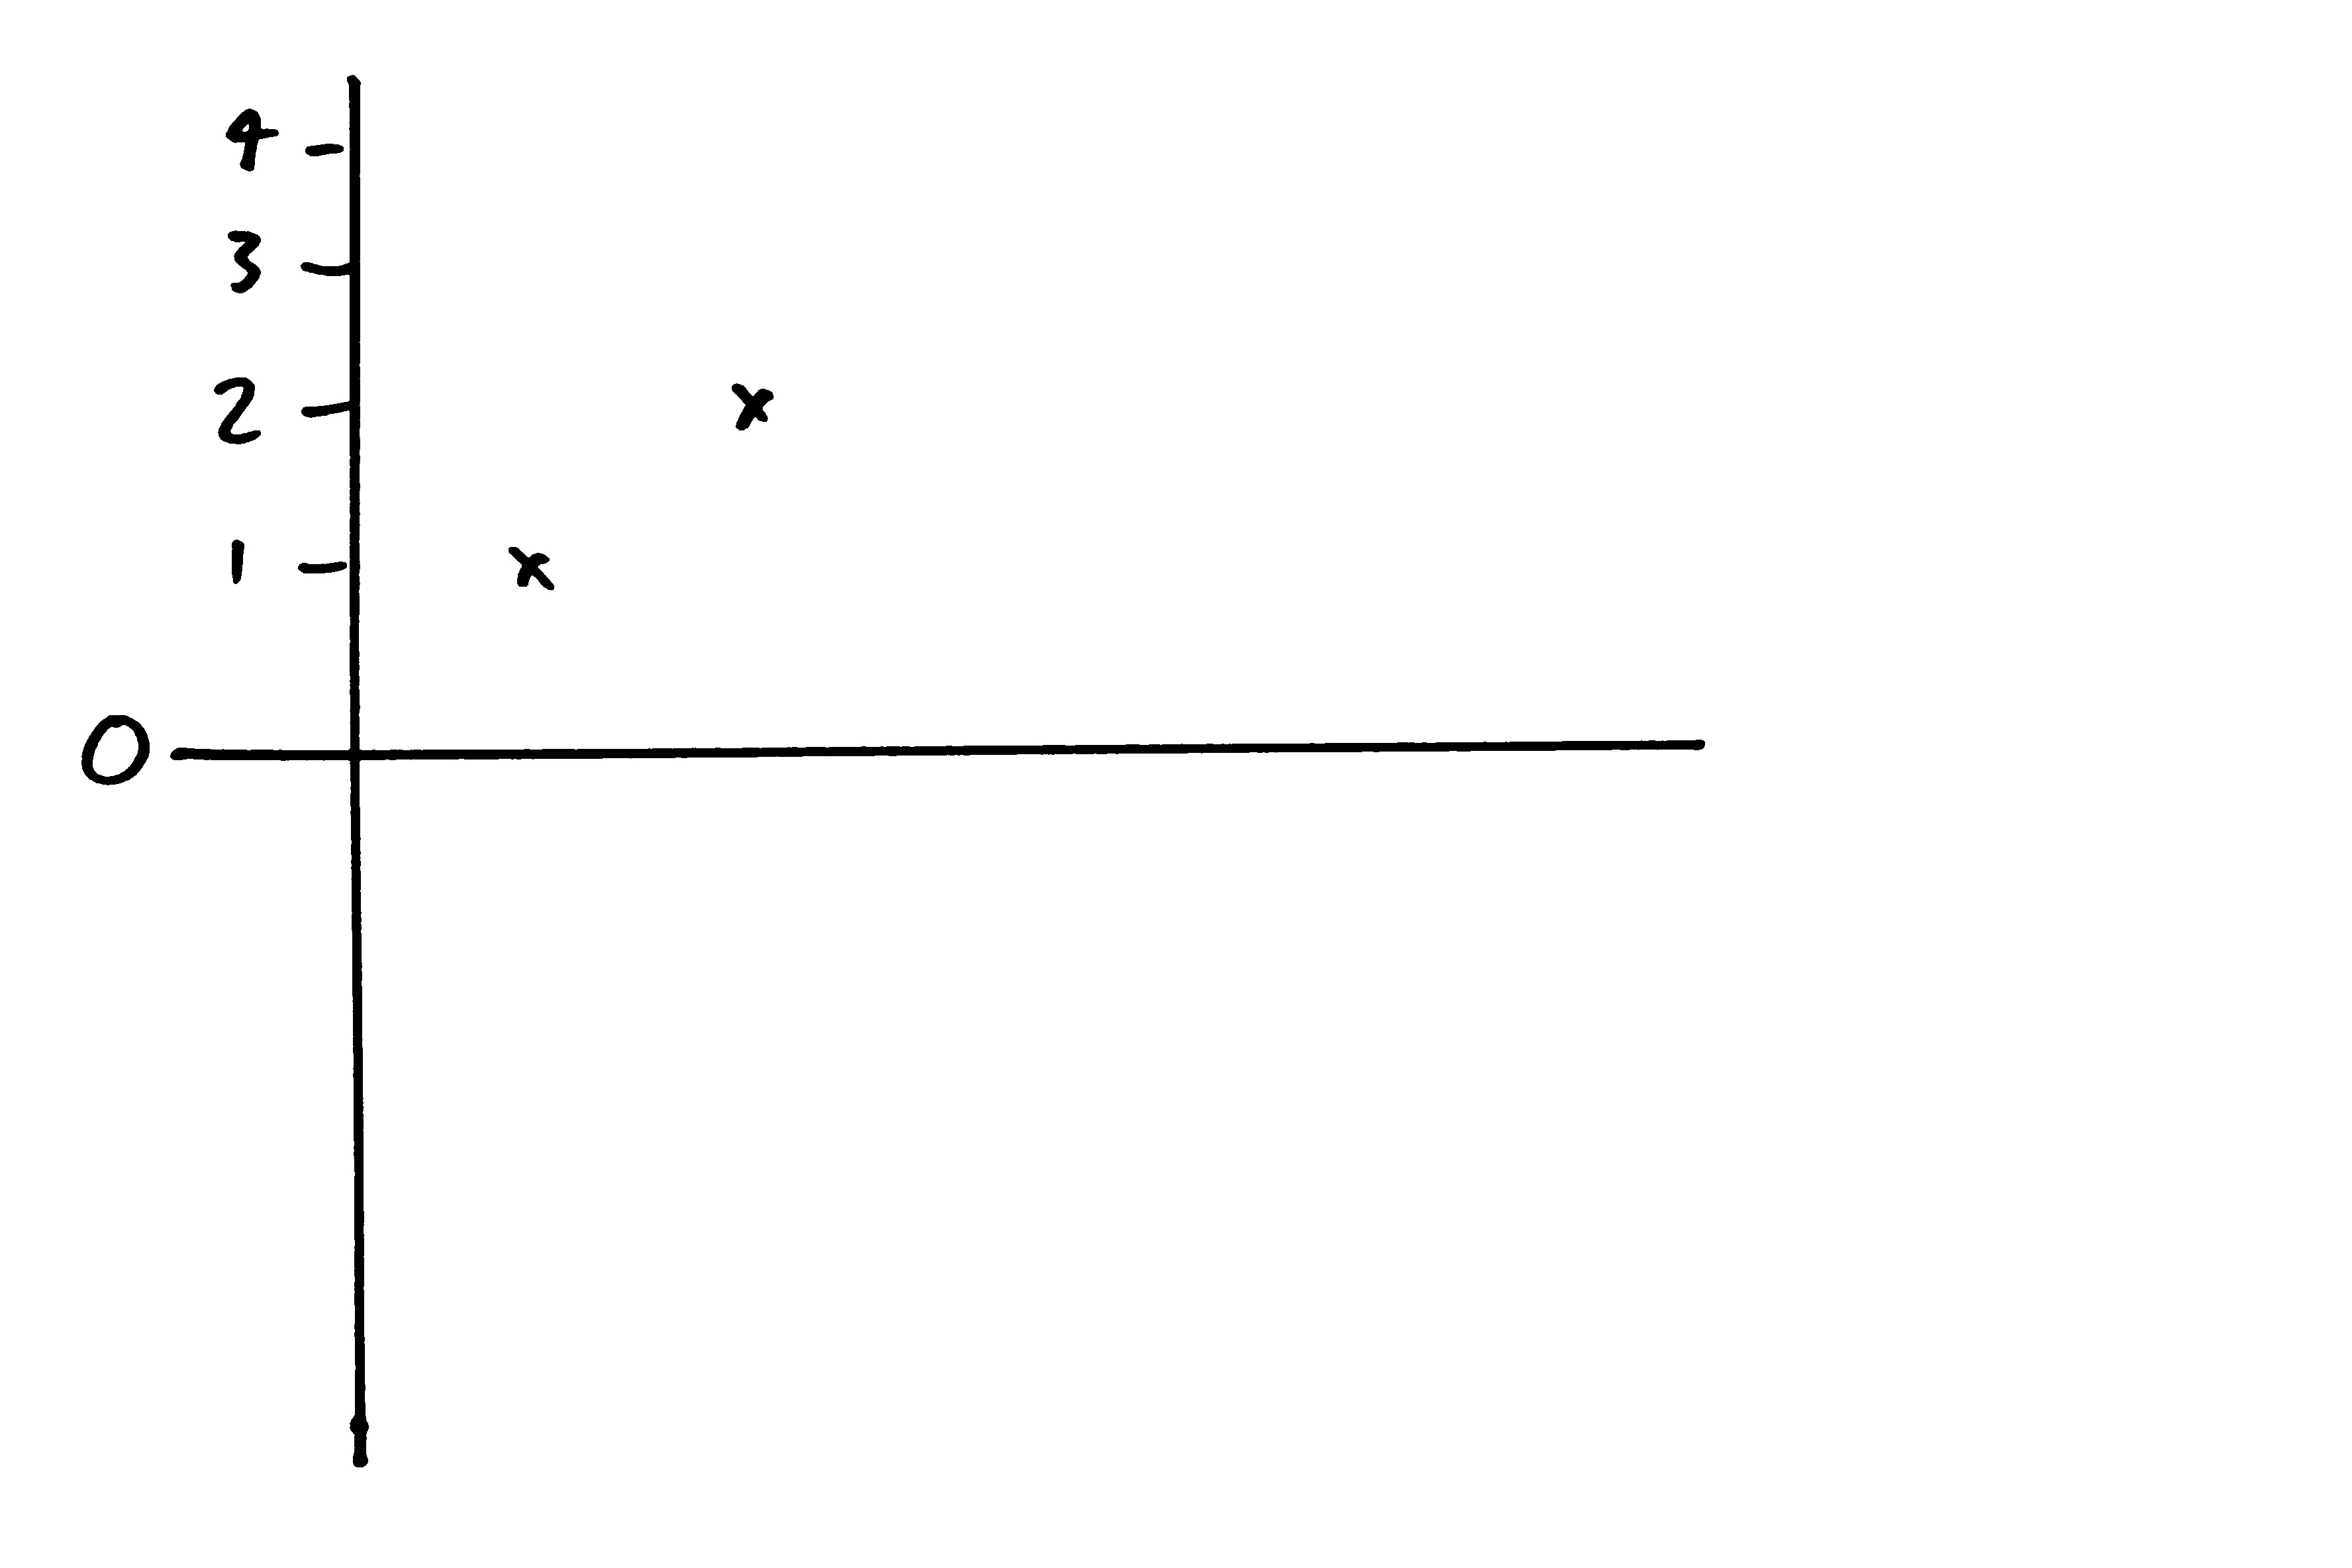
What's going on here? Well, let's get away for a moment from thinking about thousands of flips. Let's talk about 2 flips.
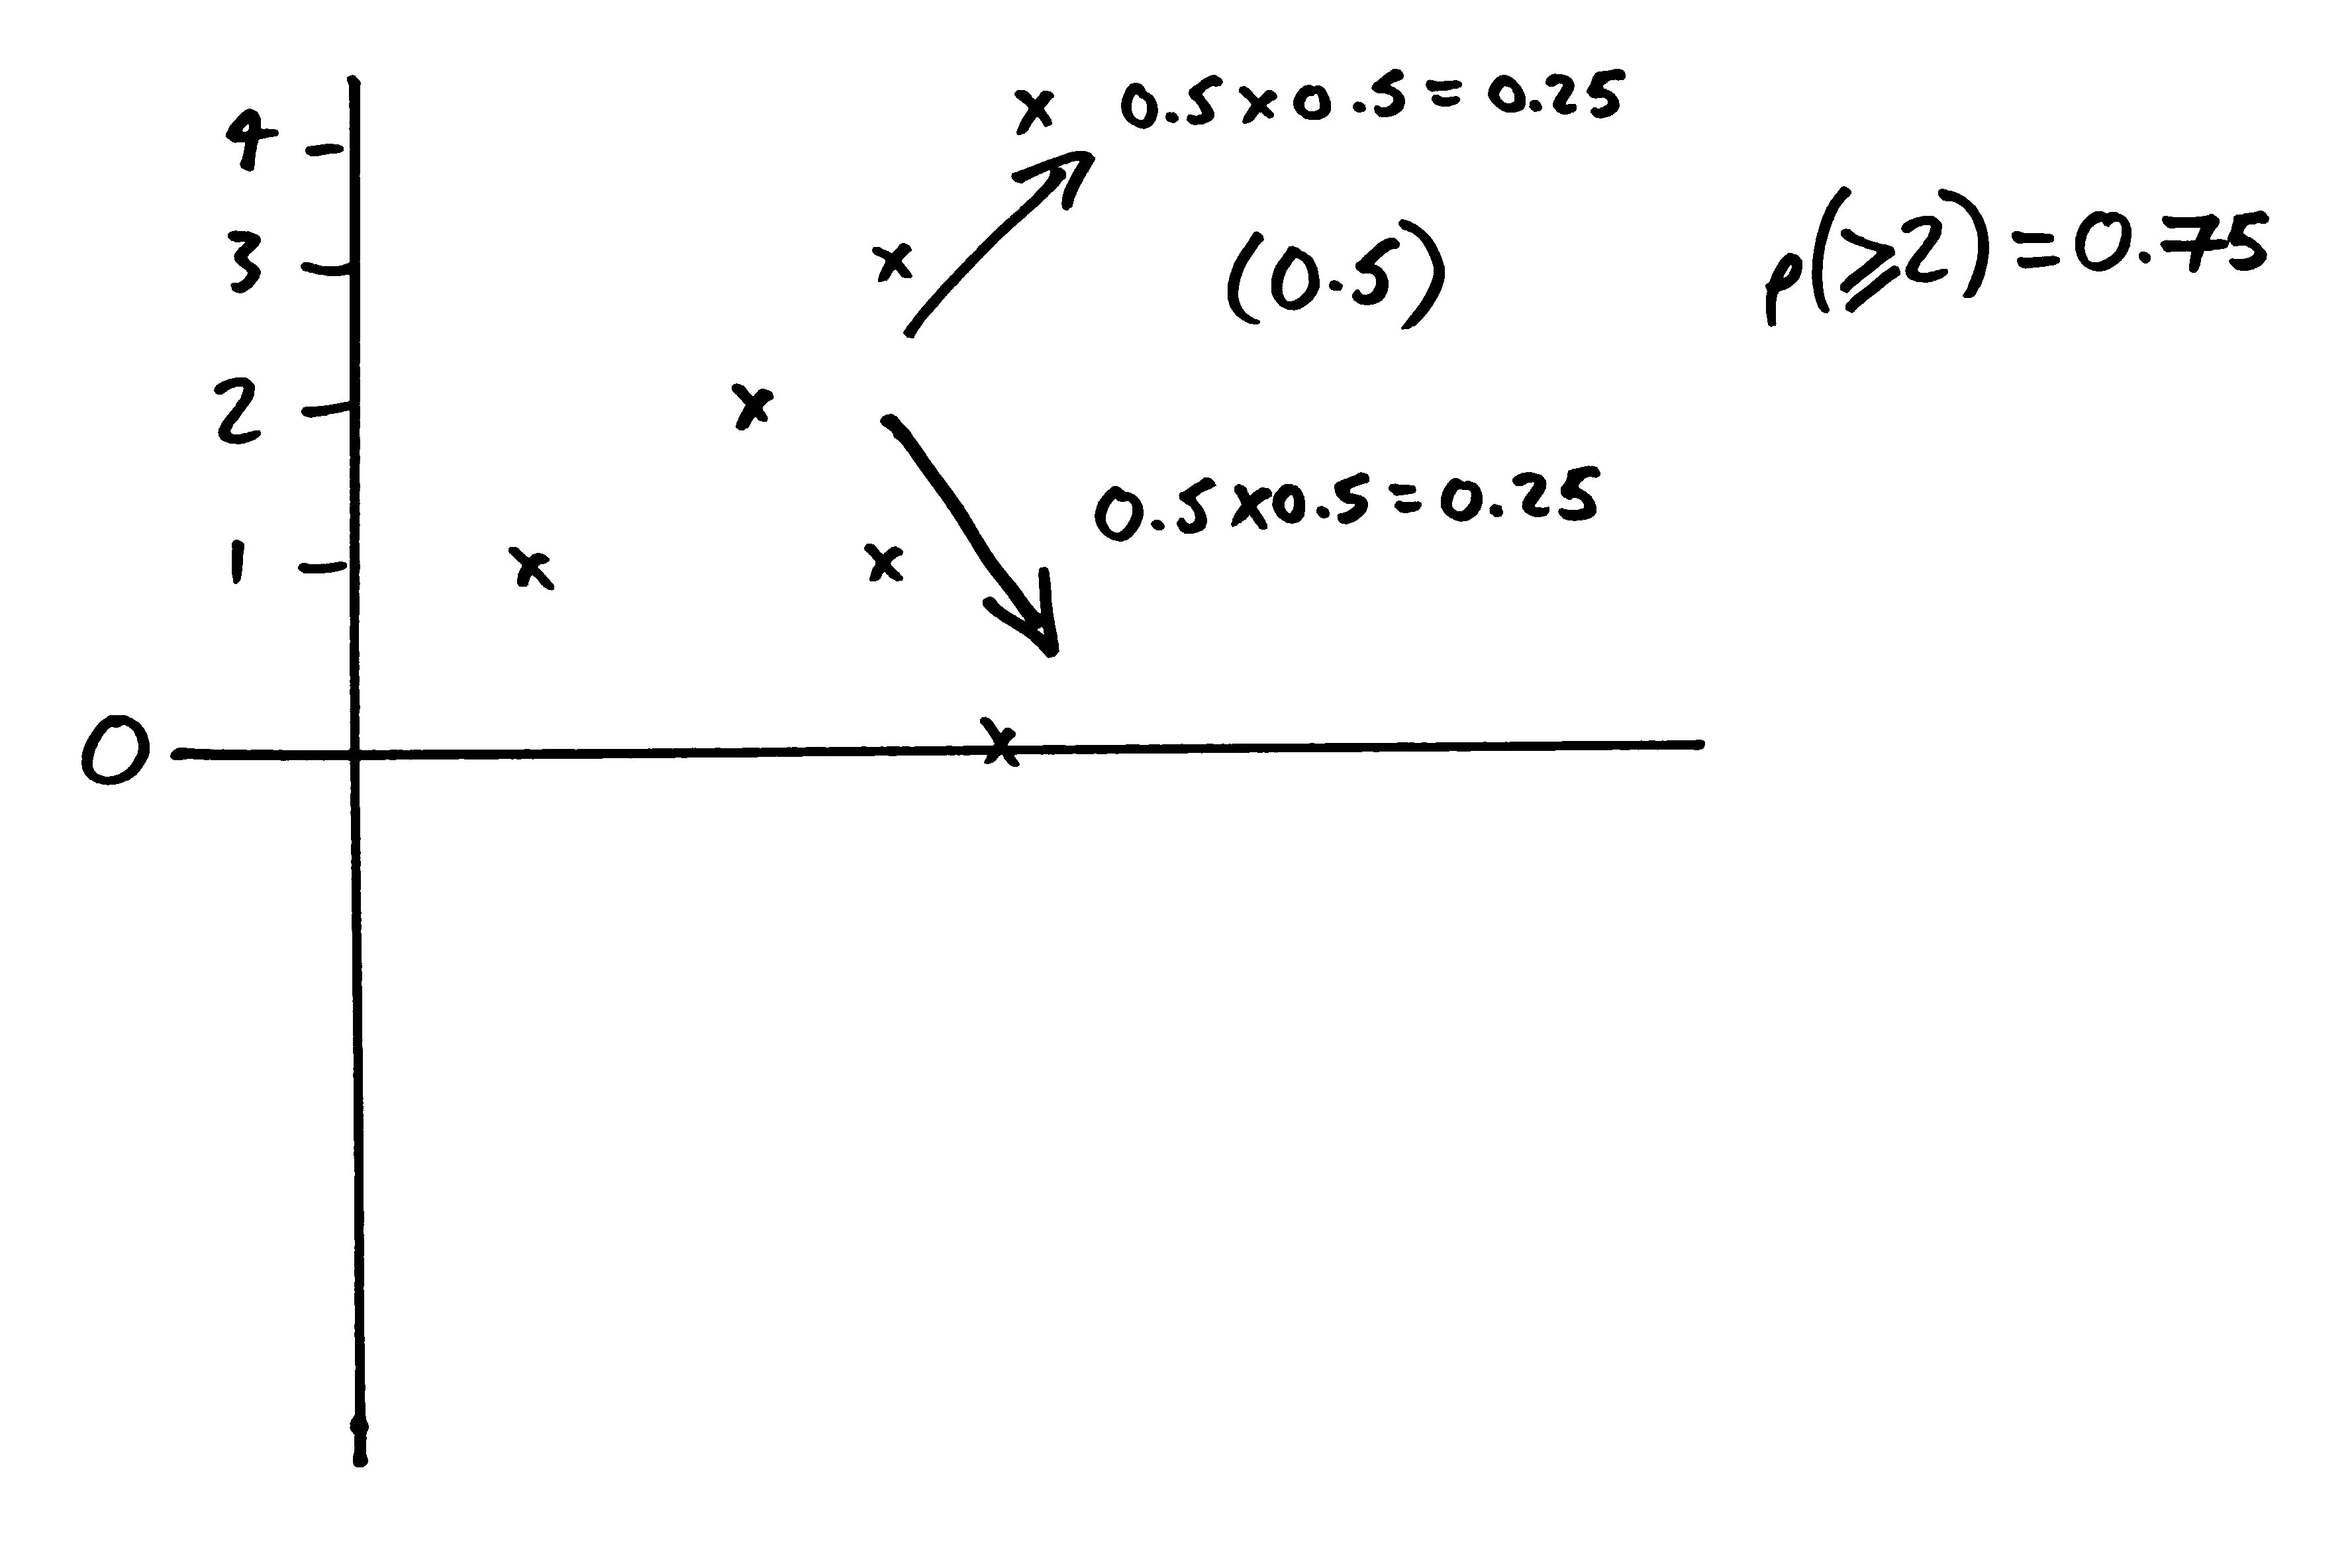
Imagine I flip heads twice in a row. That's not so improbable.
What's the probability that I get back to 0 in the next two flips? Well, I would need to flip two tails in a row. The probability of that is 0.25.
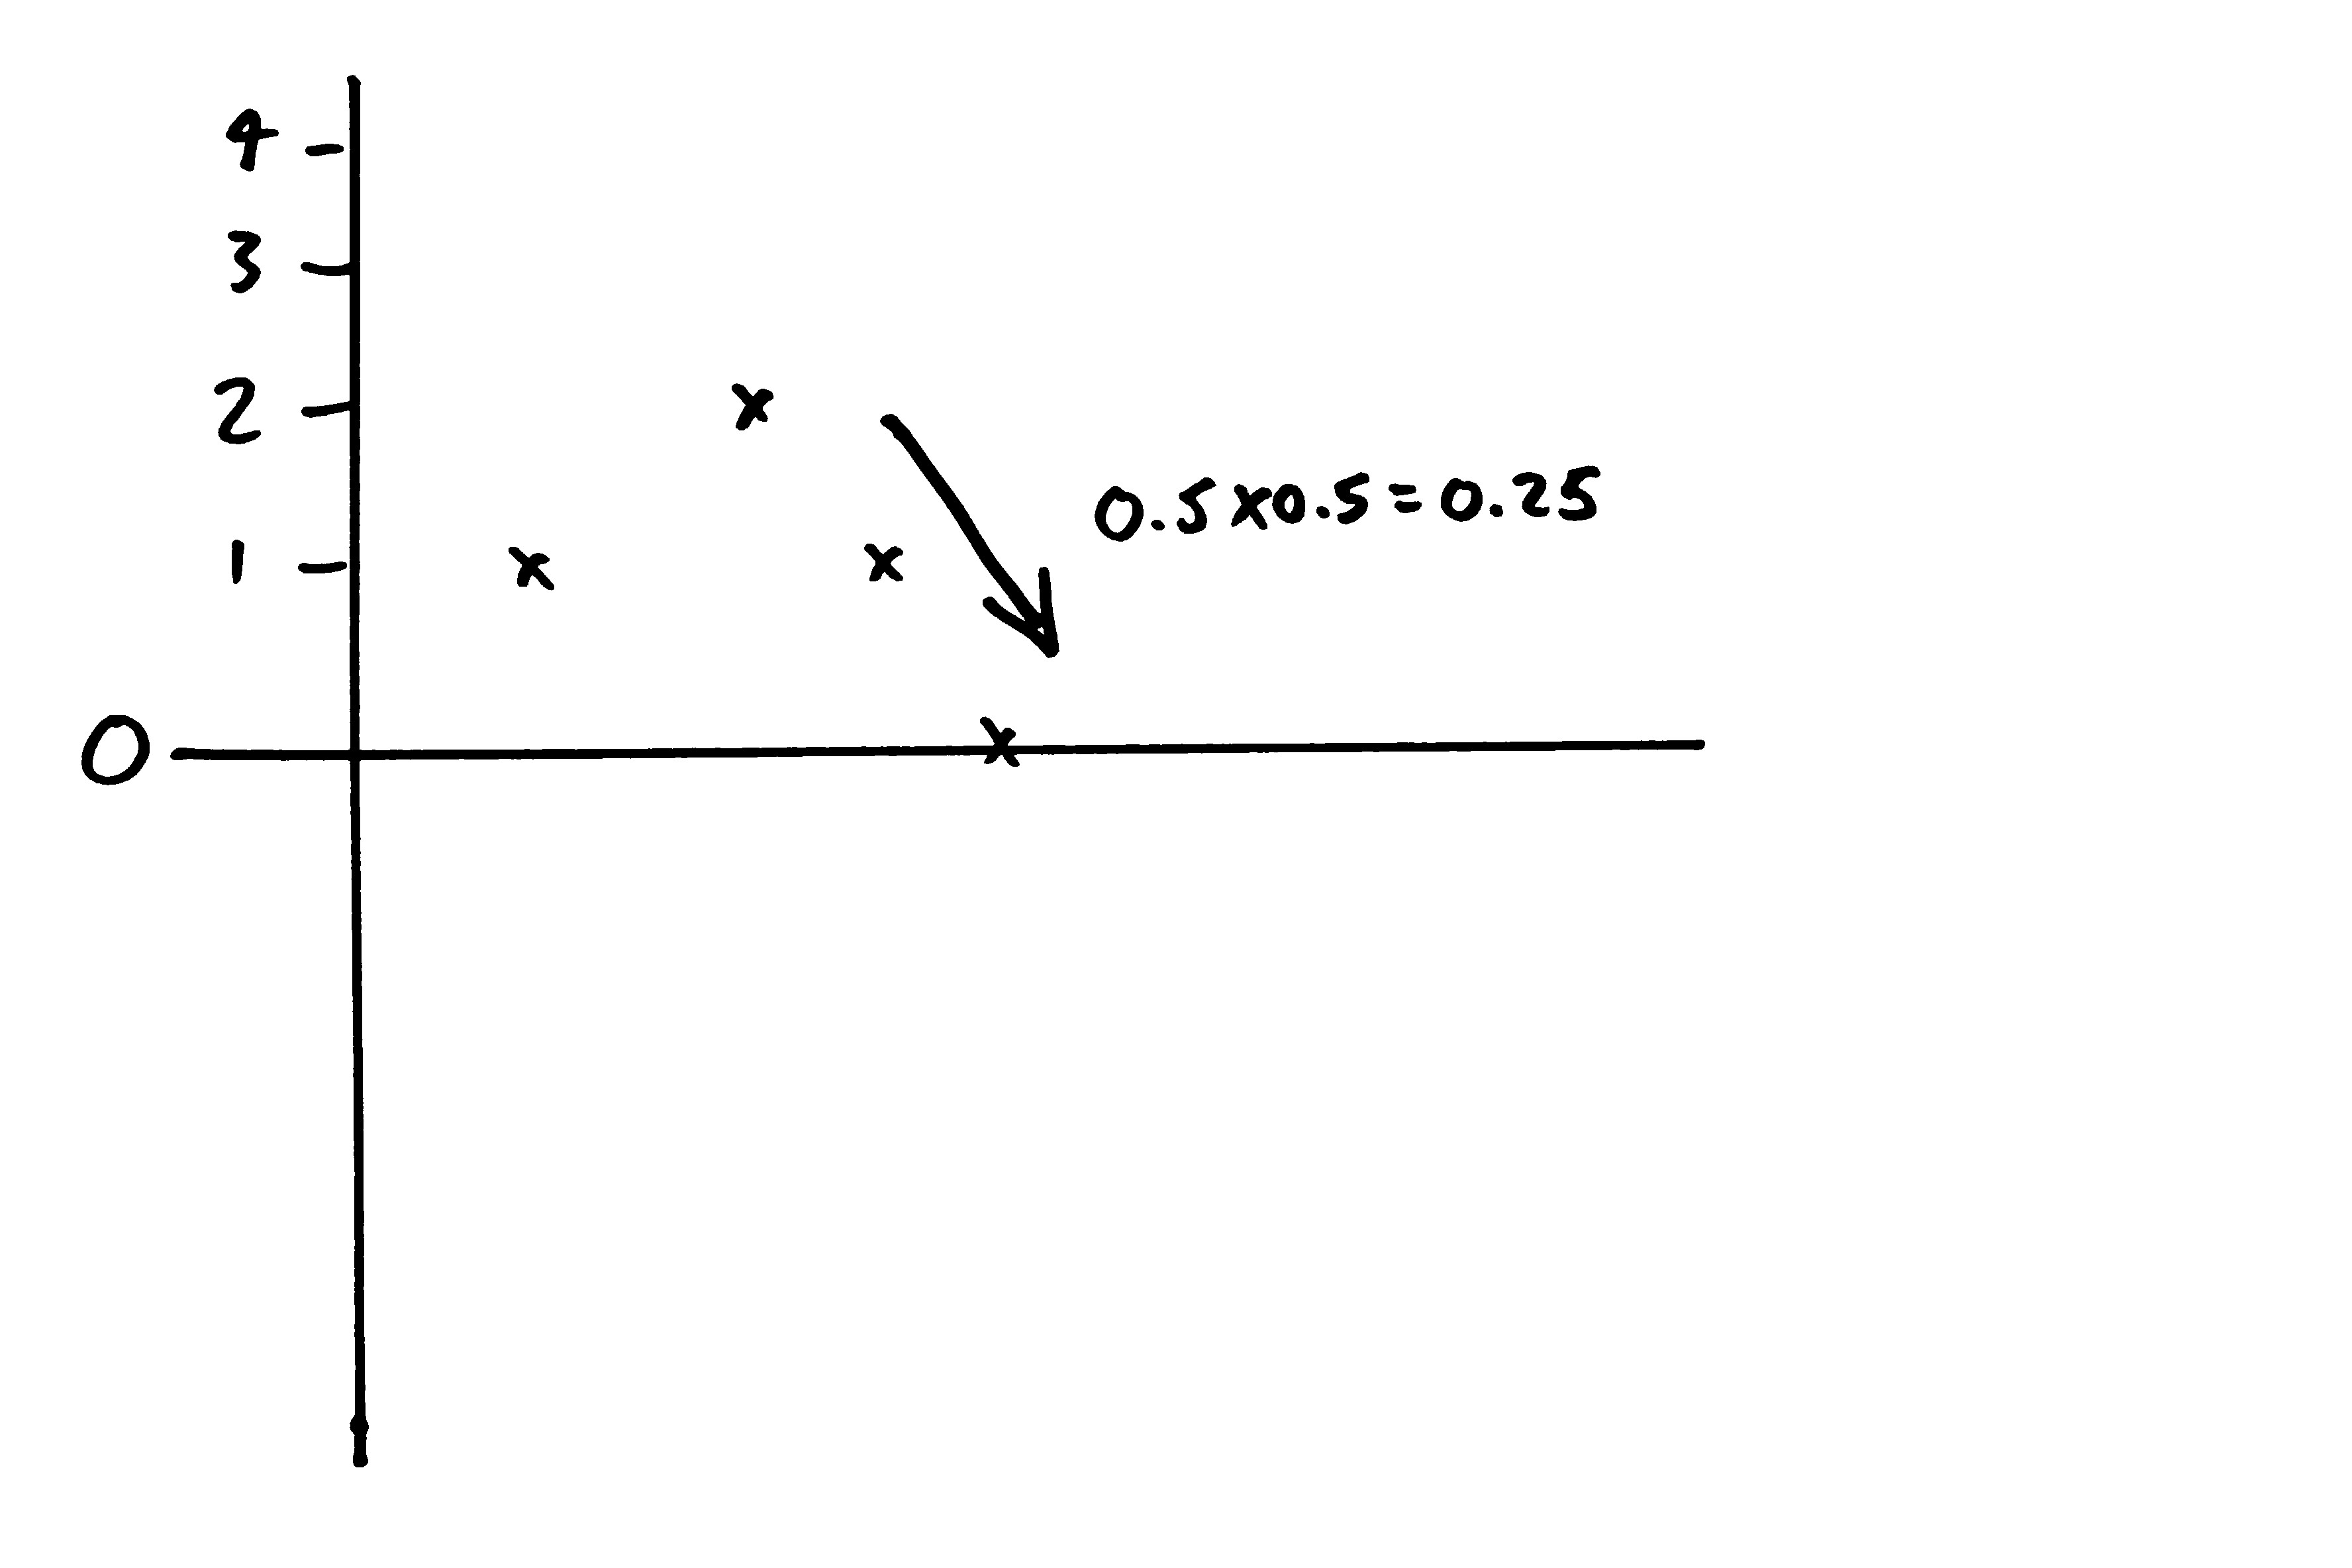
But what's the probability I instead get to 4 after the next two flips? Also 0.25. The coin would need to land on heads twice in a row, which is just as likely.
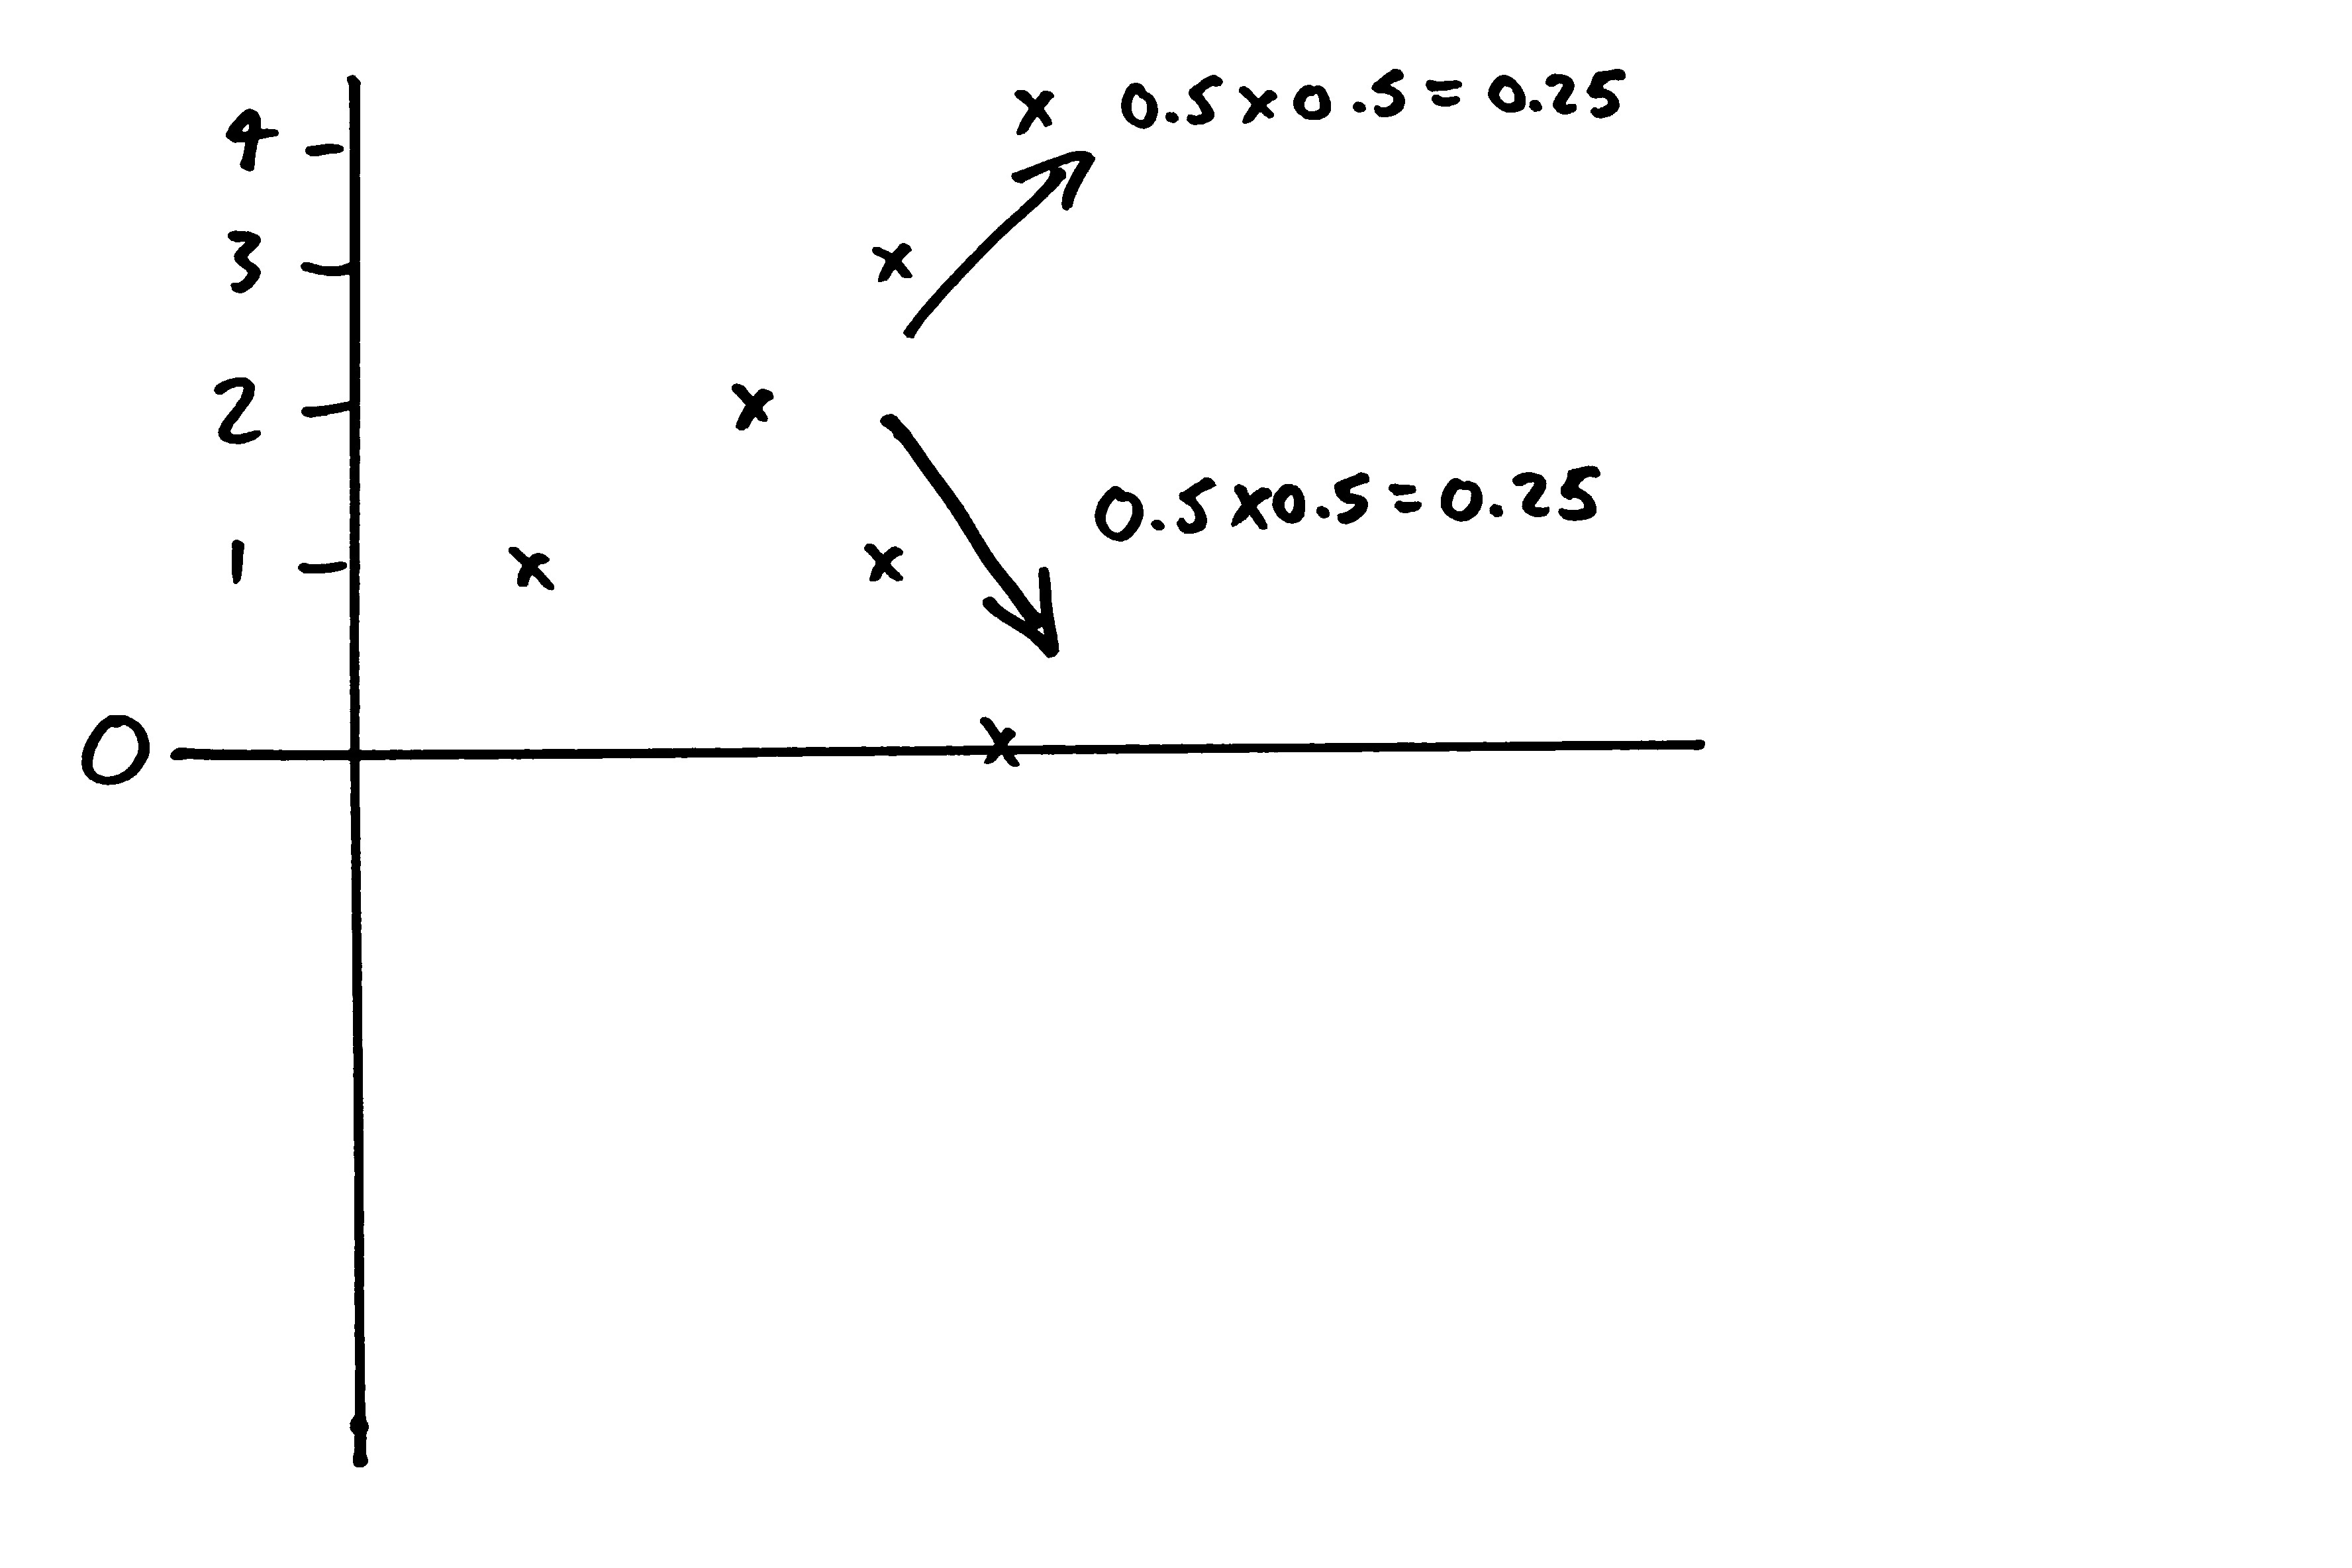
The other possibilities (heads then tails, or tails then heads) each leave me with a total of 2. So there's a 75% chance I end up with a total that is 2 or more.
This accounts for what you will have seen in the simulation. Sometimes you get a line that stays close to 0 and kind of bounces around it, but this is the exception. Normally you see a line that gets away from 0, either in the negative or positive direction, and stays away.
Weird, huh?
There's also something weird about queues.
Let's demonstrate with another example. At the airport, a check-in agent can serve a passenger in two minutes on average. New passengers arrive on average once every 121 seconds — just over every 2 minutes. The check-in agent works at this rate admirably and consistently throughout her shift, serving on average 30 customers per hour. A new passenger joins the queue on average every 121 seconds - just under 30 customers per hour.
Let this play out for a while1, and tell me: how many people would you expect to be waiting in the queue, on average? Think about it and make a guess.
Maybe you said zero? Maybe you said one or two? After all, the agent is capable of serving 30 customers per hour, and just under that number of passengers arrive per hour. So it seems like she should have time to check everyone in and the queue would never grow. Right?
But maybe you were burned by my last little game, and this time you said a really high number for the queue size.
What if I told you the line would have 118 people in it? With an average wait time of almost four hours for a new passenger?2 Because that's what it works out to be if you set up a system like this and leave it running. How did we get to such a long line, when we expected to have almost no line at all?
Just like the coin flips example, these numbers might seem way off to you. Here's a simulation of five queues. Play them out and see what happens, to get a feeling for how they behave.
| seconds | ||
| seconds |
| Queue length: |
0 |
|
|---|
| Average wait time: | — seconds |
|---|
I'm guessing you didn't see queues staying at or around zero for very long. What exactly is happening here?
Well, notice how many times I said 'on average'. That's really important. If every passenger is served in exactly two minutes, and every new passenger arrives exactly every 121 seconds, then the queue size would always be zero and the wait time would hence always be zero.
But that, as anyone who has ever stood in line for anything knows, is regrettably not the way the world works. Some passengers take longer to serve — they brought their passports, of course, but they put them at the bottom of their rucksacks and need to fully unpack them to get them out. Oh, and their rucksacks are too big to carry on and need to be checked in. Other passengers are really quick — they've done this a thousand times and have everything ready. Sometimes one passenger arrives, and it's a long while until the next one arrives — the train to the airport was cancelled so there's a gap. Sometimes a whole school trip group arrives at once, throwing stuff around, making a bunch of noise, and generally being teenagers in a place where no one asked for there to be teenagers. Then you finally get to the front of the line, and you were in the wrong queue all along.
In short, there is randomness operating on this process. Both the arrival times and services times are variable and unpredictable around their average. And if our coin flip taught us anything about randomness, it's that randomness is weird, and we don't always have the best intuitions about it.
What's going on? We have a random process which is fundamentally memoryless. A flip of the coin onto heads does not have any influence on the next coin flip. A passenger taking 10 minutes to check in doesn't make it any less likely that the next passenger takes 10 minutes to serve as well. And onto these memoryless processes we impose our belief — our fervent hope — that they will somehow 'fix themselves' and 'even themselves out over time'.
But that's not what happens. While our agent is checking in that passenger that takes 10 minutes, we expect almost five more passengers to join the queue. So we've gone 'above the line'. To deal with that swelling of the queue behind the slow passenger and get back to zero, our check-in agent would need to deal with the next few passengers quickly enough to make up the difference — actually, 9 customers in the next 10 minutes. But that's just as likely as her having another 10-minute passenger, leading to an additional five people in the queue.
Like the coin flips, once this queue starts growing, it's just as likely to continue growing as it is to shrink. And clearing the queue becomes less and less likely as the queue grows. This effect is even more pronounced than in the coin-flip example because there is no possibility for the queue size to be a negative value. When there is no one in the queue, the server needs to wait.
What does this all mean? Why have I talked about coin flips and airport queues for so long, on the blog of a company that works with software development teams?
Software development processes are full of queues — product backlogs, pull request queues, deployment trains, and so on — and those queues are subject to randomness. There’s randomness on the arrival side — a new requirement came out of nowhere; one developer worked for weeks then opened 3 giant pull requests — and on the service side — Jo is out sick for the next week, blowing up all our estimates; feature A made us build some library functions which made feature B far easier, making us much quicker than expected.
If we’ve learned anything from the coin flips and the airport check-in counter, it’s that when randomness is operating on a cumulative process (like a queue) our intuitions can steer us wrong. If our processes involve queues, and if there is randomness operating on those queues, we need to design those processes so that randomness doesn’t lead to much longer queues than we intuitively expected. And we need to do this design work guided by what we’ve learned about queues.
There's much more to say about queues, queueing theory, and software development. We'll talk about it more — including the ways in which an airport check-in queue is economically different from a product backlog — in part two of this series.
1: I'm being intentionally inexact here. The point is to allow enough time for this system to have run and to get into a steady state where we can draw conclusions about its behaviour on average, and that varies depending on the outcomes of a series of random events.
2: As an additional exercise/head-scratcher: what happens when we instead have two check-in agents working at that same rate of 30 passengers per hour, and people arrive at the same rate — just under 30 passengers per hour. What would the average queue length be? Half of 118? Well, it's 0.3, with an average wait time of just over 39 seconds.
3: How the queue simulations are implemented: we pre-compute a series of arrival intervals and a series of service times such that they fall into a Poisson distribution around their expected value. Using these times, we generate an ordered series of arrival and service events, as well as the queue length after each event. What is especially interesting to realize is that service events depend on whether anyone is actually in the queue. Service events start either when the previous service ends, or, if the queue is empty when the service is ready, when the next arrival occurs. We replay these events sped up; the event time and the queue length of each event is used as the x and y of data points on the chart.